
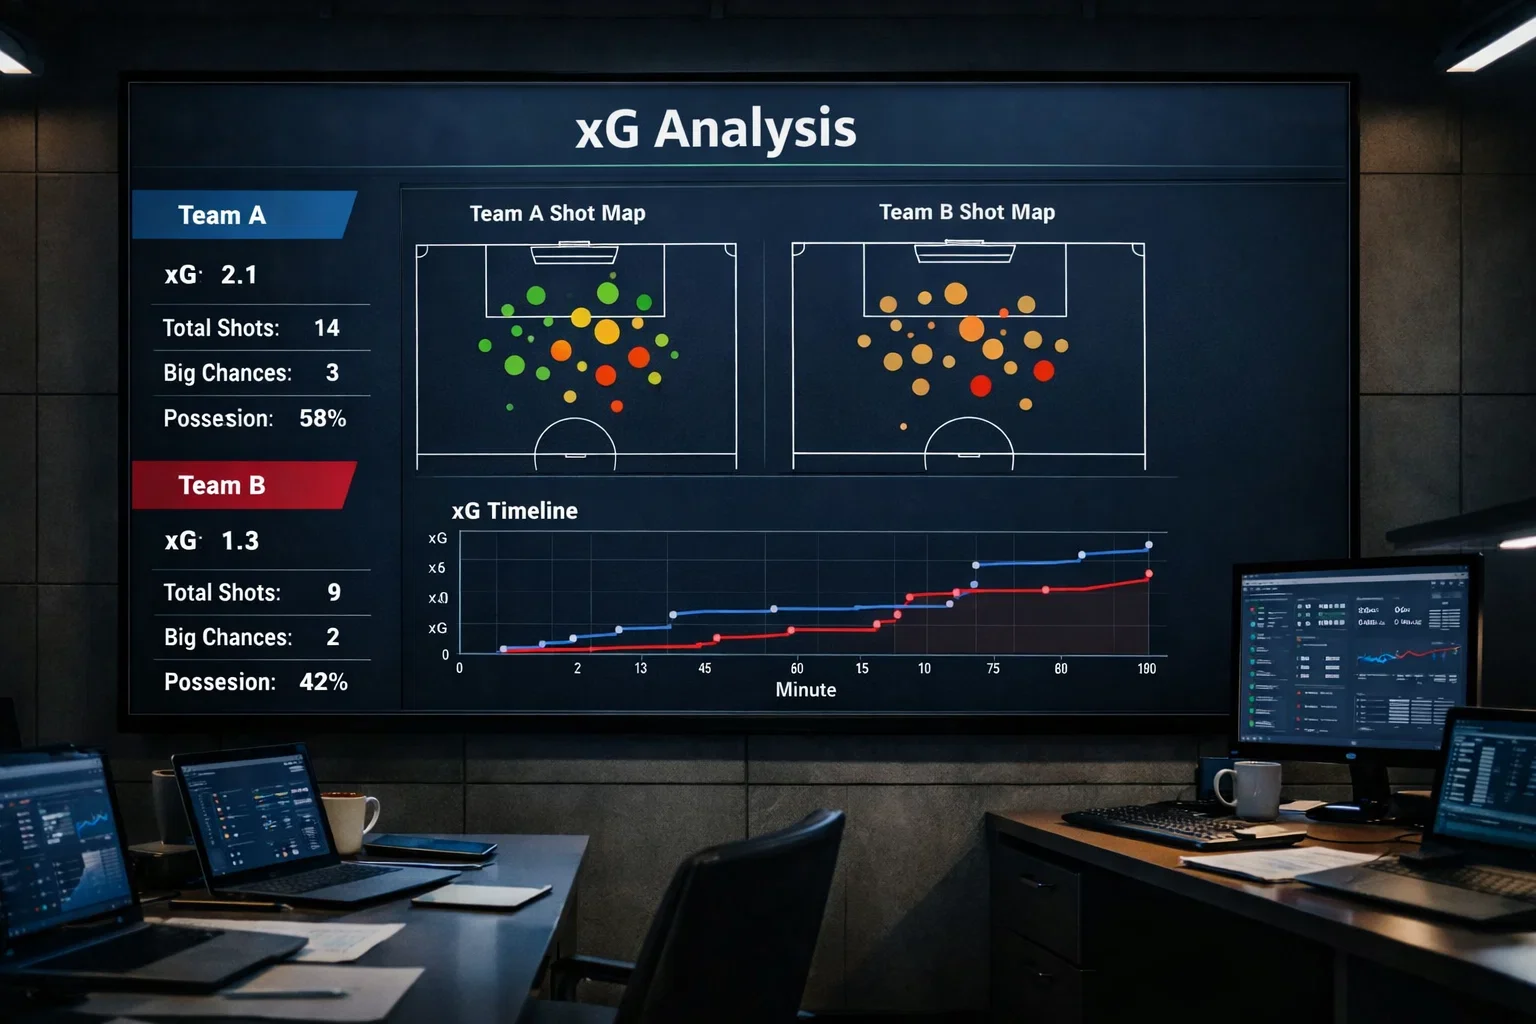
Expected goals (xG) has transformed football analysis from results-based evaluation to process-based understanding, and this transformation creates specific betting opportunities in Bundesliga markets. When teams significantly outperform or underperform their xG metrics, regression pressure builds — results eventually align with underlying chance creation quality rather than persisting indefinitely in divergent patterns. Identifying these regression candidates before betting markets adjust creates systematic edge that pure results analysis cannot capture.
The Bundesliga generates approximately 3+ goals per match through an attacking culture that produces substantial xG data for analysis. This goal volume provides larger samples than lower-scoring leagues, enabling more confident xG-based conclusions earlier in seasons. Bayern Munich’s elite chance creation (approximately 2.5-3.0 xG per match) compared to relegation candidates generating barely 1.0 xG per match illustrates the quality variation that xG metrics reveal beyond simple results.
Understanding xG Fundamentals
Expected goals assigns probability scores to every shot based on historical conversion rates for similar situations. A penalty carries approximately 0.76-0.79 xG because roughly 76-79% of penalties historically convert. A header from outside the six-yard box might carry 0.06 xG because similar headers rarely produce goals. Accumulating these shot probabilities across matches generates team xG totals that represent expected scoring based on chance quality rather than actual finishing outcomes.
The gap between actual goals and xG reveals finishing luck that regression analysis can exploit. When teams score substantially more than their xG suggests (overperformance), they’ve benefited from elite finishing or opponent goalkeeper errors that statistical expectation predicts will normalize. When teams score substantially less than their xG (underperformance), they’ve suffered from poor finishing or exceptional goalkeeping that should regress toward historical averages.
Similar logic applies to defensive xG (xGA — expected goals against). Teams conceding fewer goals than their xGA have benefited from opponent finishing failures or exceptional goalkeeping. Teams conceding more than xGA have suffered from opponent finishing luck or goalkeeper errors. Both defensive performance extremes face regression pressure that xG analysis identifies before results-based evaluation recognizes the divergence.
The practical betting application involves identifying teams whose current results diverge significantly from underlying xG metrics, then backing positions that profit from expected regression. Back underperforming teams before their results improve to match chance creation quality. Fade overperforming teams before their results decline toward sustainable levels.
Identifying Regression Candidates

Bayern Munich’s 2024-25 season illustrated overperformance that xG analysis revealed clearly. Through early season matches, Bayern scored 33 goals from just 24.24 xG — an overperformance exceeding 8.5 goals that led the league. This divergence suggested either unsustainable finishing excellence or opponent goalkeeper collapse, both of which regression analysis predicted would normalize over larger samples.
Attacking overperformers warrant fading approaches in specific contexts. Their current results reflect finishing quality that exceeds sustainable long-term rates, meaning their future scoring should decline toward xG-suggested levels. Backing unders on their team totals, or backing opponents to score when facing their temporarily-depressed defensive attention, captures regression value.
Attacking underperformers warrant backing approaches. Teams scoring substantially fewer goals than xG suggests have created quality chances that finishing randomness has prevented from converting. As samples grow, their conversion should improve toward historical averages, producing improved results that current standings don’t reflect. Backing these teams before results improvement materializes captures value that post-regression positioning won’t provide.
Defensive xG divergence creates similar opportunities. Teams like RB Leipzig who concede substantially fewer goals than xGA (5 goals from 18.46 xGA early in 2024-25) benefit from opponent finishing failure or goalkeeper excellence that faces regression pressure. Backing opponents’ scoring markets against these teams captures expected conversion improvement. Conversely, teams conceding more than xGA face likely defensive results improvement that current form doesn’t suggest.
xG and Match Betting Applications
Translating xG insights into match betting requires understanding how regression timelines affect optimal market selection. Regression doesn’t occur in single matches — it materializes gradually across samples. This gradual nature makes single-match outcome betting unreliable despite valid xG-based analysis.
Goals markets suit xG analysis better than match outcomes because regression affects scoring rates directly. When xG analysis suggests a team should score more than current rates, backing their team totals captures expected finishing improvement. When analysis suggests a team should concede more than current rates, backing opponent goals or BTTS propositions captures expected defensive normalization.
Asian handicap betting can incorporate xG insights when handicap lines reflect results-based positioning rather than xG-based quality assessment. If a team’s poor results have inflated handicap lines against them despite strong xG metrics, backing them at enhanced handicaps captures value from expected results improvement. The handicap structure provides margin for regression to materialize without requiring immediate single-match confirmation.
Season-long markets particularly suit xG analysis because they provide timeframes where regression reliably occurs. Backing underperforming teams’ final league position at enhanced odds, or fading overperformers whose current positioning exceeds sustainable quality, captures regression value across samples large enough for statistical tendencies to manifest.
Contextual xG Analysis
Raw xG numbers require contextual interpretation that sophisticated analysis provides beyond simple actual-versus-expected comparison. Some xG divergence reflects genuine quality variation rather than random luck, and distinguishing sustainable excellence from temporary fortune determines whether regression betting actually offers value.
Finishing quality varies between elite strikers and average forwards in ways that partially justify xG outperformance. Harry Kane’s career overperformance reflects genuine finishing ability that exceeds historical averages for similar chances. When Bayern outperforms xG, Kane’s presence explains some divergence as sustainable skill rather than regression-bound luck. Evaluating which players drive team xG divergence helps distinguish skill from luck.
Shot quality within xG models also varies. Standard xG assigns probability based on shot location without fully capturing shooter quality or defensive pressure context. Teams whose xG overperformance comes from elite shooters in optimal situations face less regression pressure than teams benefiting from fortunate conversions of difficult chances. Understanding what types of chances produce divergence improves regression prediction accuracy.
Goalkeeper performance affects defensive xG interpretation substantially. Elite shot-stoppers like Gregor Kobel consistently outperform xGA through genuine saving ability that shouldn’t face regression. When teams’ defensive xG underperformance coincides with elite goalkeeper presence, assuming regression may prove incorrect. Evaluating goalkeeper quality alongside xGA divergence improves defensive regression analysis.
Building Your xG Betting Framework
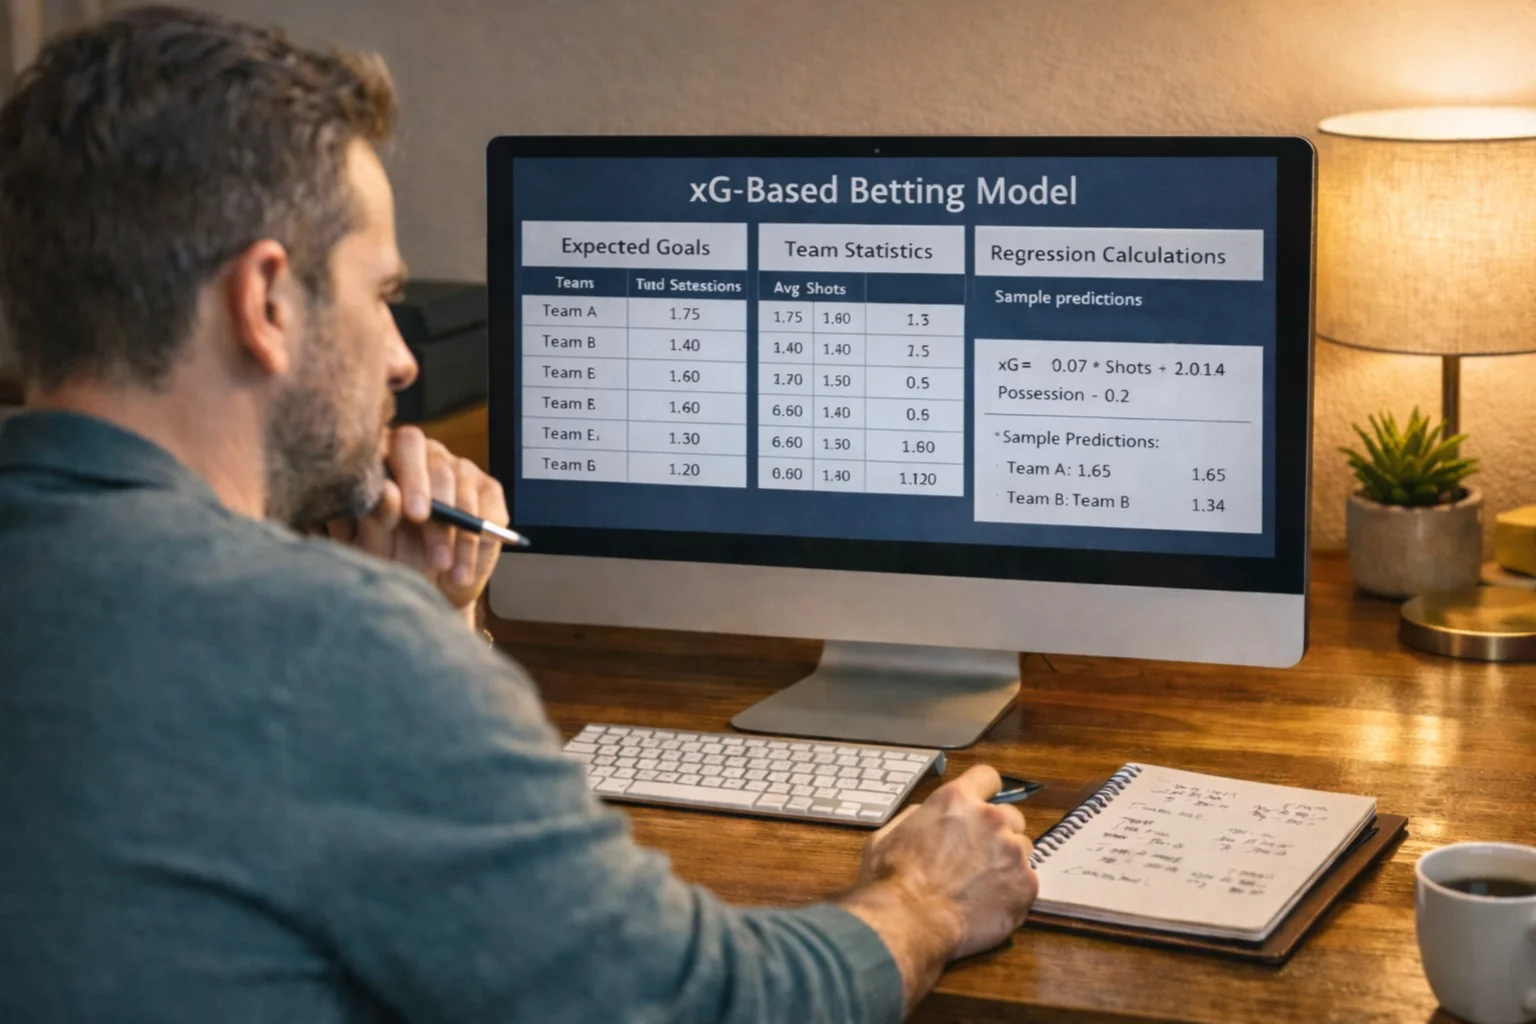
Systematic xG betting requires reliable data sources that provide accurate expected goals calculations. Several football analytics platforms offer xG data for Bundesliga matches, though methodology differences produce variation between sources. Selecting consistent data sources enables tracking across seasons without calculation inconsistencies affecting analysis.
Tracking both team-level and match-level xG enables different analytical approaches. Team-level aggregates reveal systematic tendencies across seasons. Match-level data enables specific fixture analysis when extreme xG divergence occurs in individual matches. Both perspectives inform betting differently — team-level for season-long positioning, match-level for proximate opportunity identification.
Regression timing remains xG betting’s primary challenge. Statistical principles guarantee eventual regression, but timing uncertainty means some bets lose before regression occurs and others capture regression that materializes quickly. Position sizing should acknowledge this timing uncertainty through stakes that tolerate delayed regression without bankroll damage.
Record-keeping should track xG-based selections separately from other betting to evaluate whether your regression identification adds genuine value. Did identified overperformers actually regress? Did underperformers improve as expected? What timeline characterized regression when it occurred? This evidence-based refinement enables continuous improvement in an analytically complex betting approach.
Read the specific borussia dortmund strategy.
The Limitation Acknowledgment
xG betting carries inherent limitations that honest analysis must acknowledge. Regression timing uncertainty means theoretically sound positions sometimes lose before statistical tendency manifests. Sample sizes within single seasons may prove insufficient for confident divergence identification. And some divergence reflects genuine sustainable quality rather than luck requiring regression.
These limitations don’t invalidate xG betting — they establish appropriate expectations for what the approach can achieve. xG analysis identifies value opportunities that results-based betting misses, but it doesn’t guarantee wins or eliminate variance. Maintaining realistic expectations prevents frustration when xG-sound positions lose to timing uncertainty or quality variation that models didn’t capture.
The Bundesliga’s attacking culture produces rich xG data that supports analytical betting approaches. Teams will continue overperforming and underperforming their underlying metrics, and regression will continue pulling results toward expected levels. Whether you profit from these patterns depends on developing the analytical infrastructure, timeline patience, and bankroll management that xG betting requires.
Avoid bad consistent streaks using bundesliga bet.
